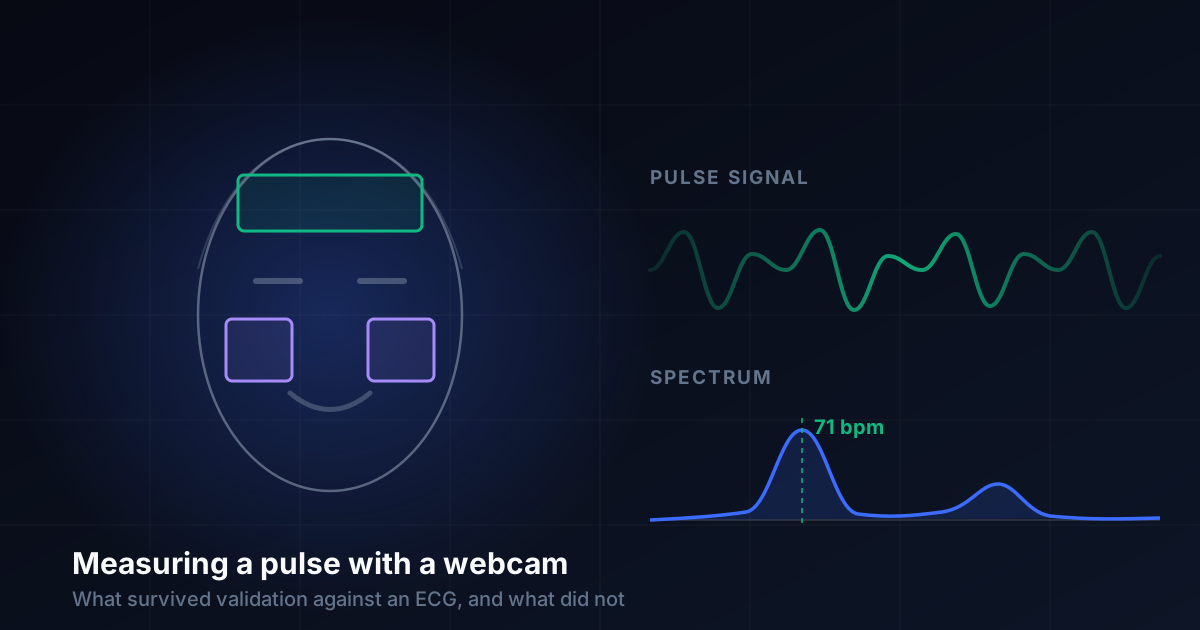
Blood moving through the skin of your face changes its colour by a fraction of a percent with every heartbeat. You cannot see it. A cheap webcam can, if you sit still in reasonable light and the arithmetic afterwards is careful. This technique is called remote photoplethysmography, or rPPG, and there is a lot of published work behind it.
I built one as a browser experiment. Then I did the thing that most demos skip: I checked it against a medical-grade reference. Three of its four metrics did not survive that check, and the story of why is more useful than the thing that was left.
What this article covers
- Why browser-only: health data that never leaves the device, because there is nowhere for it to go.
- Validation against an ECG: what agreed, what did not, and by how much.
- Three deleted metrics: heart rate variability, rhythm classification and pulse transit time, and the specific reasons each was impossible.
- Smoothing as a liar: how averaging produced a rock-steady number that was three beats per minute wrong.
- What actually limits accuracy: not sensor noise, but a problem the code was creating for itself.
Try it: the rPPG experiment runs entirely in your browser.
The motivation: nowhere for the data to go
Consumer health tools have a default posture of shipping your data somewhere. A heart rate reading is a small thing on its own, but a stream of them is a behavioural record: when you woke, when you were stressed, when you exercised, when you were sitting at a screen at two in the morning. Once it is on someone's server it is subject to their retention policy, their breach history and their next change of ownership.
The interesting property of rPPG in a browser is that none of that has to happen. Every frame is processed in JavaScript on the page. There is no upload endpoint, no analytics on the measurements, no account. The video never lands on a disk. When you close the tab, the data is gone, because the only copy was in memory.
This is not a privacy policy, which is a promise. It is an architecture, which is a constraint. The distinction matters: a promise can be revised in a changelog, whereas code with no network call in it cannot leak what it never transmits. The one exception is deliberate and explicit - a "Log Data" button that writes a JSON file to your own device, which is how the validation below was possible at all.
Checking it against something that actually works
A pulse measurement that has never been compared to a reference is a plausible-looking animation. I had a Pixel Watch to hand, which records a single-lead ECG at 250 Hz, so each session ran the webcam and the watch within about a minute of each other.
The watch exports a PDF. Usefully, the waveform in that PDF is stored as vector polylines rather than a bitmap, so the actual samples can be pulled straight out - 7,379 points per 30-second recording. Detecting R peaks on that gives a beat-by-beat reference to compare against. As a sanity check on the extraction, my computed average matched the figure the watch prints on its own report.
Three sessions, one person. Hold that number in mind for the accuracy section.
The first version was confidently wrong
The original build displayed four metrics: heart rate, heart rate variability, a rhythm classification, and pulse transit time. All four had reasonable-looking numbers that updated smoothly. Here is what the ECG said about them.
Pulse transit time could not have worked
The idea was to measure the delay between the pulse arriving at the cheek and at the forehead. The code found peaks in each signal, subtracted the times, and accepted any result between 5 and 150 ms.
At 30 frames per second, peak times land on a grid 33.3 ms apart. Inside an acceptance window of 5 to 150 ms there are therefore exactly four values the measurement can ever return: 33.3, 66.7, 100.0 and 133.3 ms. Everything else was discarded. The average of whatever survived was guaranteed to look physiologically sensible, because the filter had been built to only admit sensible-looking numbers. The output was quantisation noise wearing a lab coat. Real forehead-to-cheek differences are a few milliseconds, well under the resolution available.
Heart rate variability was 54 times too large
HRV was reported as RMSSD, the root mean square of successive differences between beats. The ECG measured 9.9 ms. The webcam reported an average of 537 ms.
That is not a calibration error, it is a readout of the beat detector's own jitter. Examining every interval the pipeline accepted showed a distribution with two big piles: 17% sat exactly at the 330 ms refractory floor, meaning the detector was firing twice per beat, and 13% were over 1,200 ms, meaning it had missed a beat entirely. Only about a quarter were anywhere near the true interval.
There is also a hard limit underneath the detection problem. I simulated a perfect beat detector against the real ECG rhythm, with the only error being that peak times snap to the video frame grid:
| Frame rate | Reported RMSSD | True RMSSD |
|---|---|---|
| 30 fps | 25.9 ms | 9.9 ms |
| 60 fps | 14.4 ms | 9.9 ms |
| 120 fps | 11.6 ms | 9.9 ms |
Even with flawless detection, 30 fps inflates RMSSD by a factor of 2.6. The metric was unrecoverable at this frame rate regardless of how good the rest of the pipeline became.
The rhythm classifier cried wolf continuously
The most uncomfortable finding. The original code classified rhythm as regular or irregular from the scatter in beat intervals. Across one 40-second recording it reported "Irregular (High Scatter)" on 1,202 of 1,202 samples - 100% of the time. The watch, using an algorithm that has been through a clinical study, scored the same subject during the same period as normal sinus rhythm.
The interval scatter it was reacting to was entirely its own detector's noise. A tool that tells a healthy person their heart rhythm is irregular, every single second, is worse than useless: it is the kind of thing that sends someone to a doctor in a panic, or worse, teaches them to ignore a warning that might one day be real.
All three metrics were deleted. Not fixed, deleted. Heart rate variability and rhythm both depend on knowing when each individual beat occurred, and even after substantial improvements the best-quality windows detected only about 12 of every 20 real beats. There is no amount of clever filtering that recovers timing information the frame rate never captured.
Smoothing hides instability, and that is a problem
This deserves its own section because it caught me twice, and the second time was in code I had written specifically to avoid the first.
The original heart rate display averaged the last ten estimates. That sounds like sensible noise reduction. But each estimate came from a 10-second window recomputed continuously, so consecutive estimates shared almost all of their input data. Averaging ten of them is not averaging ten independent measurements; it is one measurement with extra lag, dressed up as a consensus.
Worse, the mean of a badly-behaved distribution can be accidentally right. That original pipeline reported 77.5 bpm against an ECG's 78.8 - apparently excellent - while only a quarter of its underlying intervals were correct. The double-detections and the missed beats cancelled each other out in the arithmetic. Take the median instead of the mean and the same data gives 85.7 bpm, seven beats out. The headline number was right by luck, and luck does not generalise.
Having diagnosed that, I added a "rate spread" indicator to show how much the estimate was wobbling - and made exactly the same mistake. Analysis runs every 500 ms over a 15-second window, so consecutive estimates overlap by 97%. The spread was therefore near zero by construction. In the session where the reading was 3.3 bpm wrong, that indicator serenely displayed 0.4 bpm of variation. It now only keeps estimates that are at least half a window apart, so the windows are substantially independent and the number means something.
The general lesson: a stable number is not an accurate number. Smoothing improves how a measurement feels while actively concealing how much it should not be trusted. If you show a confidence indicator, check what it is actually computed from, because a confidence indicator that is wrong is more dangerous than none at all.
The real limit was self-inflicted
With the impossible metrics gone, the remaining question was why heart rate itself was unreliable. The intuitive answer is sensor noise - a webcam is not a scientific instrument, and the signal is a fraction of a percent.
The measurement said otherwise. Decomposing where the signal power actually sat:
| Component | Share of variation |
|---|---|
| Slow drift (0.1-0.7 Hz) | 86.7% |
| The pulse itself (0.7-3 Hz) | 9.6% |
| Broadband noise (above 3 Hz) | 3.7% |
Noise was almost irrelevant. Nearly everything was slow drift, drowning the pulse by nine to one. The next question was where the drift came from. If it were room lighting or the camera's auto-exposure, both sampling regions would move together. They did not: the correlation between the forehead and cheek drift was -0.24. Each region was drifting independently, which meant the cause was local to each patch.
It was the patches themselves. They were derived from the bounding box of four face-mesh landmarks, which produced a forehead patch of roughly 29 × 28 pixels and a cheek patch 8 pixels wide. Face tracking jitters by a pixel or two frame to frame, which for an 8-pixel-wide box swings around 12% of its contents in and out continuously. The code was manufacturing the interference that was drowning its own signal.
Making the regions proportional to the face rather than to four landmarks, sampling both cheeks, masking out non-skin pixels, and smoothing the box positions took the sampled area from about 260 pixels to about 3,100. Measured on the next recording, drift fell from 41% to 23%, signal quality rose from 0.35 to 0.51, and the proportion of windows good enough to trust went from 6% to 51%.
The debugging lesson
Three times in this project I was confident about a cause and wrong. I assumed noise, and it was drift. I assumed lighting, and it was the code's own region jitter. I assumed a steeper filter and smarter region weighting would help, tested both, and both made accuracy worse - so neither shipped. Measuring which of several plausible explanations is true, before writing the fix, saved more time than it cost every single time.
Refusing to answer
The single most valuable feature turned out to be the ability to display nothing.
Every 15-second window gets a quality score: the share of in-band power concentrated in the dominant frequency and its harmonic. If that score is below its threshold, no number is shown. Measured against the ECG, the effect of that gate on the shipped code was to take the error from 10.8 bpm average to 1.0 bpm, at the cost of discarding roughly 80% of windows in that session.
Discarding 80% of your output feels like failure. It is the opposite. The alternative is presenting the other 80% as though it were equally trustworthy, which is precisely what the first version did. A blank readout that says "not confident" is honest; a number that is quietly 11 bpm out is not.
The same reasoning shaped the on-screen guidance. It distinguishes between "you are moving" and "the signal is weak for some other reason", because telling someone to hold still when they already are is advice they cannot act on.
So how accurate is it?
With the honest answer first: not established. What follows is three sessions with one person, in one room, with one camera.
| Session | Signal quality | Webcam | ECG | Error |
|---|---|---|---|---|
| 1 | good | 78.9 bpm | 78.8 bpm | 0.1 |
| 2 | marginal | 71.5 bpm | 74.8 bpm | 3.3 |
| 3 | good | 71.3 bpm | 70.4 bpm | 0.9 |
Around a beat per minute when conditions are good, and three when they are not - while looking exactly as confident on screen either way. That last clause is the important one. The failure mode is not a wild reading you would notice, it is a plausible one you would not.
Three sessions with a single subject is not a validation. It establishes that the thing is not fundamentally broken. Nothing here has been tested across skin tones, ages, facial hair, glasses, lighting setups, camera sensors or motion conditions, all of which are known to matter in the rPPG literature. Published research on this technique typically involves dozens of participants under controlled conditions, and this is not that.
Limitations, in full
- Pulse rate only. No variability, no rhythm analysis, no atrial fibrillation screening, no blood pressure, no oxygen saturation. Anything claiming those from a standard webcam deserves a hard look at its validation data.
- Needs 15 seconds of continuous usable signal before it will show anything, and starts over if you move.
- Frame rate bound. At 30 fps, beat-to-beat timing is quantised to 33 ms. That ceiling constrains everything downstream.
- Movement is the dominant failure. Talking, shifting, or looking away will stop it working. Breathing alone contributes about 30% of the low-frequency interference, and you cannot sit still enough to remove that.
- Lighting sensitive. Dim light, backlighting, uneven or flickering light all degrade it. A screen as the only light source is actively bad, because its brightness and colour shift with content.
- Untested across populations. Skin tone in particular affects the strength of the optical signal, and one subject tells you nothing about that.
- No absolute reference. The white-paper calibration that early versions used turned out to be mathematically inert once the extraction algorithm normalised each channel - it changed the result by 2×10-13 bpm, so it was removed.
What I would tell someone building the same thing
Validate against a reference before you build the second feature. Every hour spent making that first version prettier was an hour spent on three metrics that were about to be deleted.
Prefer refusing to answer. Deciding when not to display something is a feature, and usually a harder and more valuable one than the calculation itself.
Distrust your smoothing. Check what your confidence indicator is computed from. If consecutive samples share their input, it is measuring lag, not confidence.
Measure the cause before fixing it. My three most confident diagnoses were all wrong, and each was cheap to test and expensive to assume.
Watch for filters that manufacture their own answer. The pulse transit time acceptance window is the clearest example in this project: constrain an output to a plausible range and it will always look plausible, whether or not it means anything.
The experiment is here if you want to try it. It will probably refuse to give you a number for the first few seconds, and that is the part I am most pleased with.