Building automated workflow tools inside Google Chrome requires fighting continuous battles against background resource constraints. To conserve battery and performance, modern browsers aggressively throttle tabs that aren't actively in focus. If you try to capture screenshots of background tabs, standard APIs will return blank screens or outdated images.
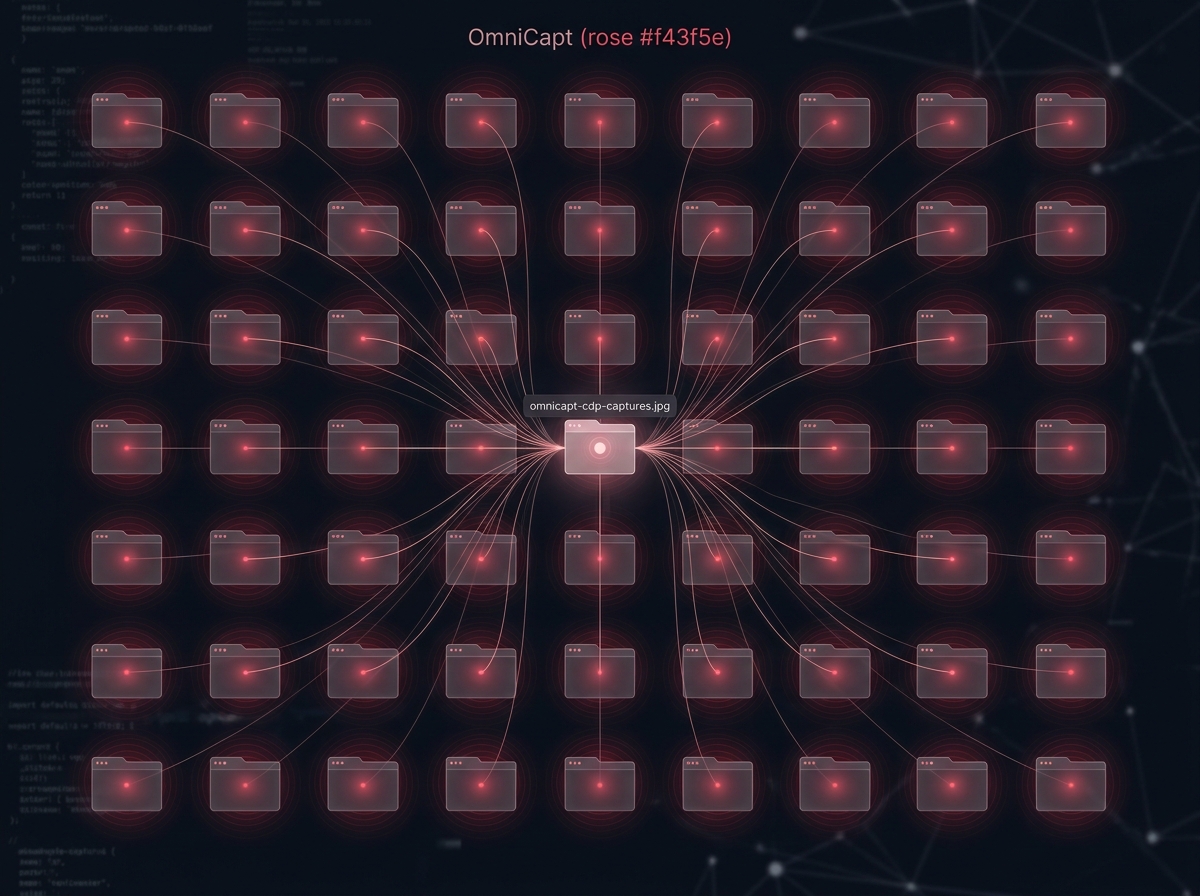
For OmniCapt, ZumiLabs engineers had to design a batch capture utility capable of taking screen snapshots of dozens of open tabs instantly. Rather than reloading pages or forcing each tab into focus sequentially (which would hijack the user's screen), we implemented an advanced system leveraging the Chrome DevTools Protocol (CDP).
Technical Deep Dive Core Points
- The Limits of Visible Capture: Why standard extension tab APIs fail in background capture scenarios.
- Chrome Debugger Attachment: Establishing a direct command bridge to background tab execution trees.
- Resolution Emulation: Forcing viewport scale adjustments without modifying visual dimensions.
- Silent Captures: Bypassing browser focus locks to snap layouts.
Part of the engineering behind OmniCapt.
The Focus Problem in MV3 Extensions
The standard extension API for screenshots is chrome.tabs.captureVisibleTab(). While simple, it has two critical limitations:
- It only works on the active window. If the target tab is not in the currently active window, or if it is behind another tab, the API throws an error.
- It is bound by screen DPR (Device Pixel Ratio). If the user is on a standard screen, they cannot snap high-density (e.g. 2x or 3x) assets.
For a batch capture utility, forcing active tabs in a loop is visually disruptive and slow. The user's screen flickers as tabs rotate, and mouse focus is lost. We needed a focus-free mechanism.
Unlocking CDP with the Debugger API
Google Chrome exposes its internal layout engine and developer inspector mechanics through the chrome.debugger API. By requesting the debugger permission in our Manifest file, OmniCapt can attach itself programmatically to any open tab and send commands directly to Chrome's rendering module.
Here is how OmniCapt establishes the debugger connection, attaches to a background tab, and requests a PNG capture buffer directly from Chrome's layout pipeline:
// Attach to the target tab using its tabId
chrome.debugger.attach({ tabId: targetTabId }, "1.3", () => {
  if (chrome.runtime.lastError) {
    console.error("CDP Attachment Failed:", chrome.runtime.lastError.message);
    return;
  }

  // Once attached, send the Page.captureScreenshot command
  chrome.debugger.sendCommand(
    { tabId: targetTabId },
    "Page.captureScreenshot",
    { format: "png", fromSurface: true },
    (result) => {
      // Clean up the debugger attachment immediately
      chrome.debugger.detach({ tabId: targetTabId });

      if (result && result.data) {
        const base64Data = result.data; // Encoded PNG string
        saveCaptureBuffer(base64Data);
      }
    }
  );
});
Overcoming Debugger Infobar Banners
Whenever an extension attaches to a tab using the debugger API, Google Chrome displays a global warning bar at the top of the browser window stating: "ZumiLabs OmniCapt" started debugging this browser.
Because this bar alters the vertical viewport size slightly, it can throw off scroll height calculations. OmniCapt compensates for this by dynamically reading the available window height offset before attachment and subtracting the standard 36px infobar height during coordinates mapping.
Batch Emulating Resolutions
Beyond background capture, developers often need to see how their layouts render at mobile, tablet, and widescreen breakpoints. Using CDP, OmniCapt can force the target tab to render at a custom dimension-completely invisibly to the user-prior to taking the shot.
This is achieved by invoking the Emulation.setDeviceMetricsOverride command through the debugger:
chrome.debugger.sendCommand(
  { tabId: targetTabId },
  "Emulation.setDeviceMetricsOverride",
  {
    width: 375,            // Mobile viewport width
    height: 812,           // Mobile viewport height
    deviceScaleFactor: 3,  // Emulate Retina Display density (3x)
    mobile: true,
    fitWindow: false
  },
  () => {
    // Page layout scales instantly. Now request the screenshot.
    chrome.debugger.sendCommand(
      { tabId: targetTabId },
      "Page.captureScreenshot",
      { format: "png", fromSurface: true },
      (result) => {
        // Clear emulation overrides
        chrome.debugger.sendCommand({ tabId: targetTabId }, "Emulation.clearDeviceMetricsOverride");
        chrome.debugger.detach({ tabId: targetTabId });

        // Save mobile asset
        saveImage(result.data, "mobile_viewport.png");
      }
    );
  }
);
Conclusion: A True Developer Utility
By leveraging Chrome DevTools Protocol debugger pipelines, OmniCapt bypasses focus constraints and hardware limitations. Developers can configure massive batch queues to capture multiple resolutions of dozens of tabs in parallel. The entire operation executes silently in background threads, keeping the user's focus precisely where it belongs-on their code.